Blood Sugar Tracker with Apple Health
Bring recent Apple Health glucose data into Gludiary, use Premium for ongoing import and write sync, and review it in one focused tracker.
Explore featureFree to download · iOS 17+
Log your glucose in seconds, see your trends, and share a clear report with your doctor.
Gludiary is a private blood sugar tracker for iPhone. Record each reading with a large-button numpad, tag it by meal context, and watch your patterns take shape across 7-day to 1-year charts. It does not measure your glucose. You enter readings from your meter or CGM, and Gludiary helps you make sense of them. This is general health information, not medical advice.
Gludiary is free to download on iOS 17 and above. Log your blood sugar in seconds, tag each reading by meal context, follow your trends and time in range, and generate a doctor-ready PDF or CSV, all from your iPhone. Gludiary Premium unlocks the full reading history, unlimited reports and a medication tracker, with a 7-day free trial. Your health records are stored locally on your iPhone.
Free to download · iOS 17+

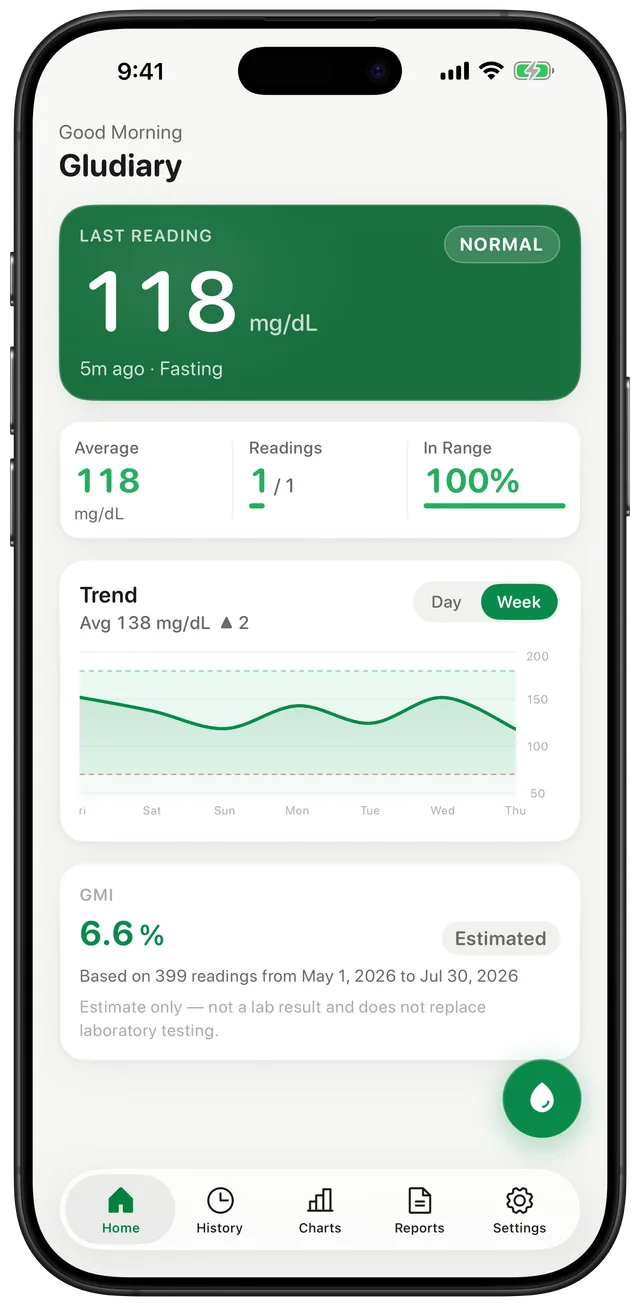
Your dashboard at a glance: last reading, daily average, time in range, a weekly trend and your GMI.
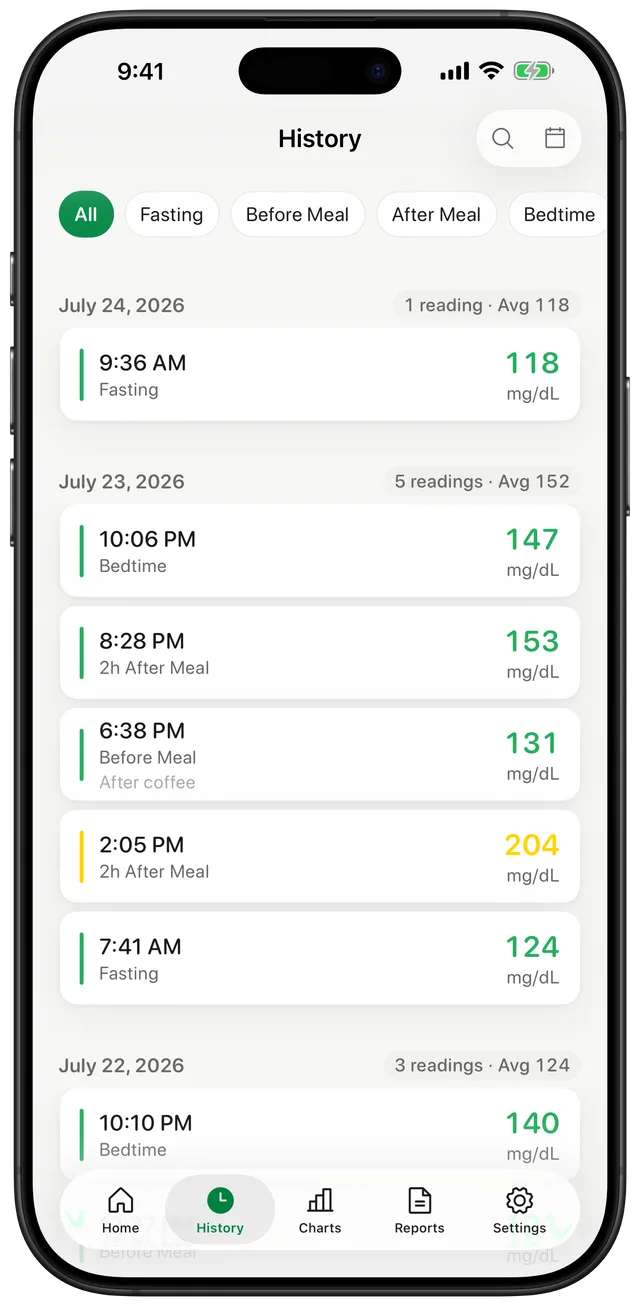
Every reading, grouped by day and filterable by meal context: fasting, before meal, after meal or bedtime.
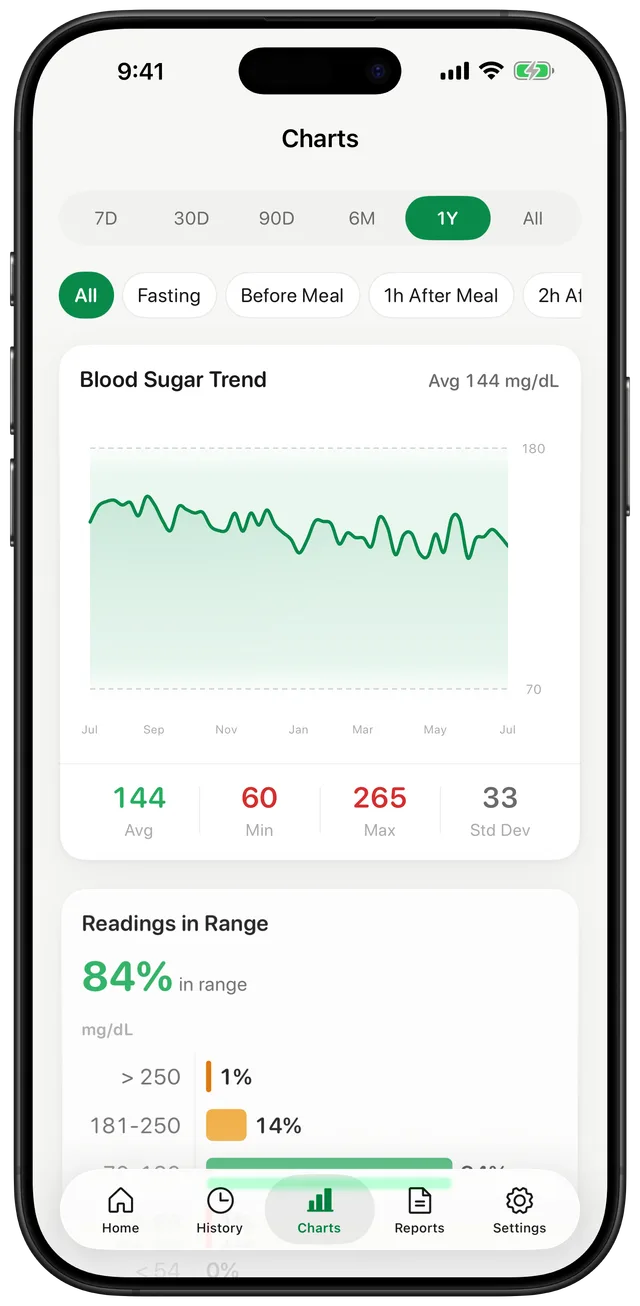
Trend charts from 7 days to 1 year, with your average, range and a clear time-in-range breakdown.
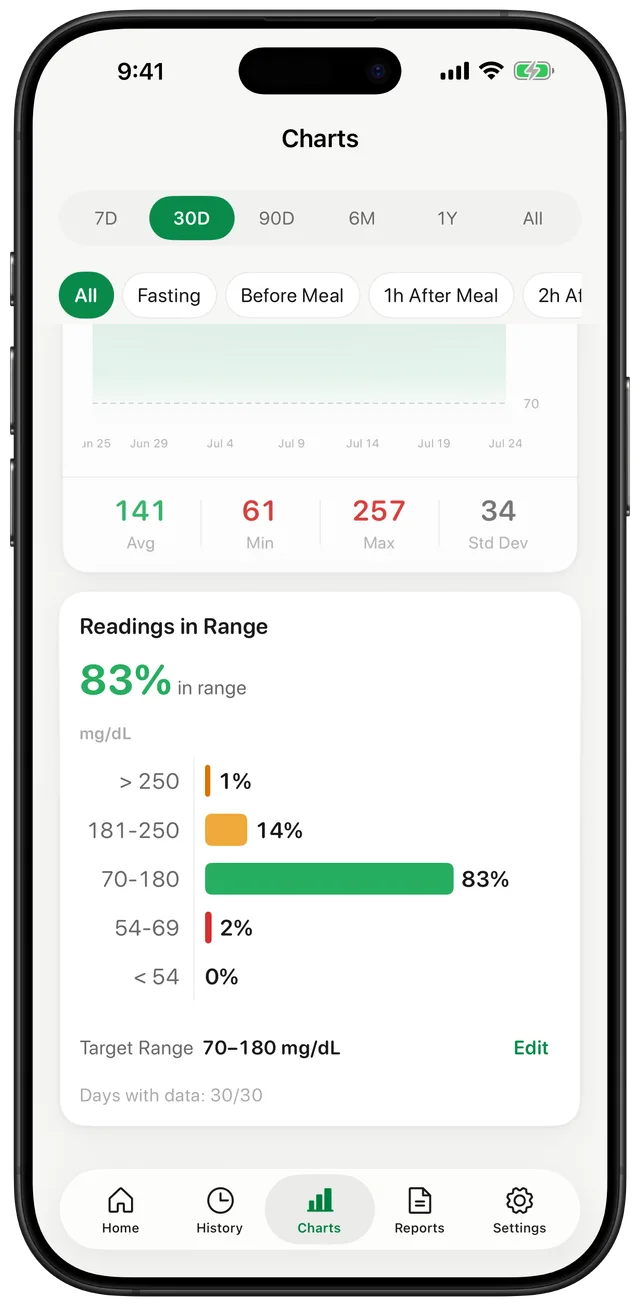
A closer look at time in range, broken down by band, with insights that flag patterns like frequent morning highs.
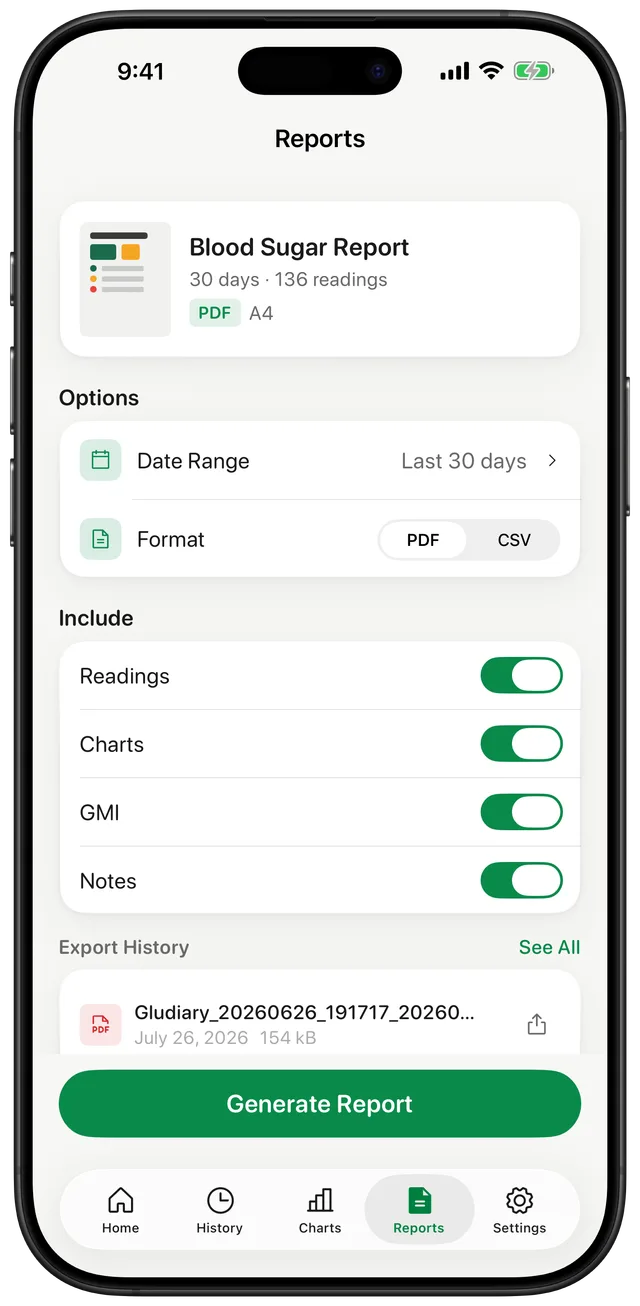
Build a doctor report in PDF or CSV. Choose the date range and what to include, then generate.
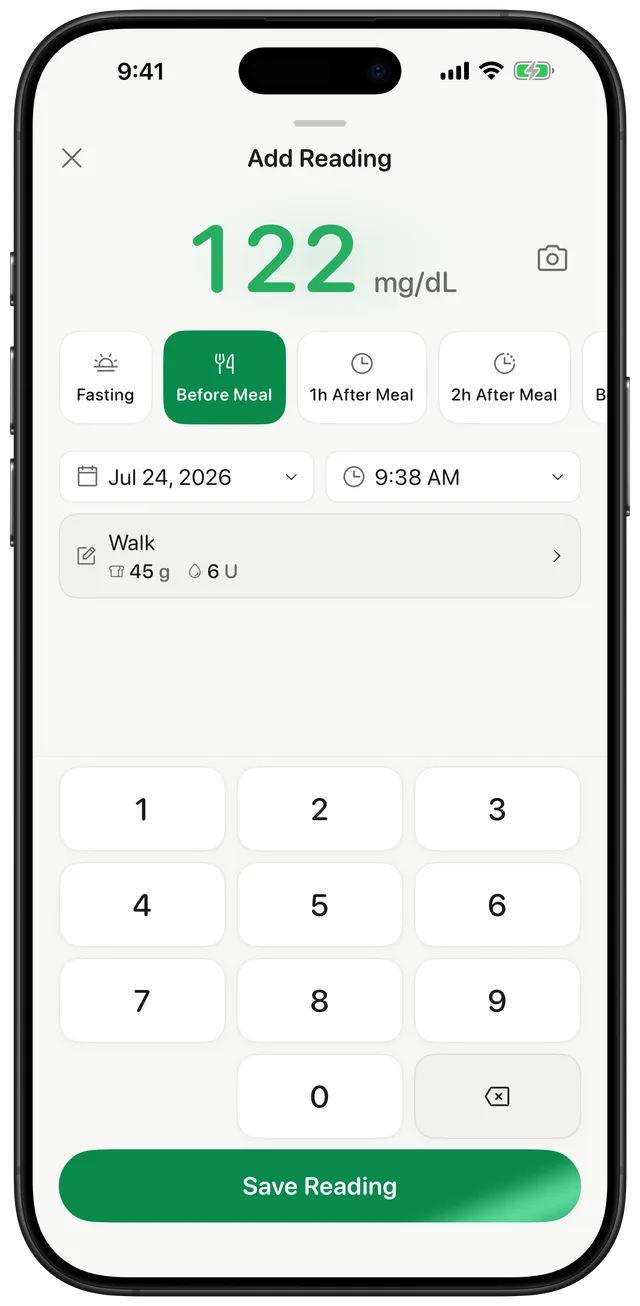
Log a reading in seconds. Tag the meal context, add a note, and save.
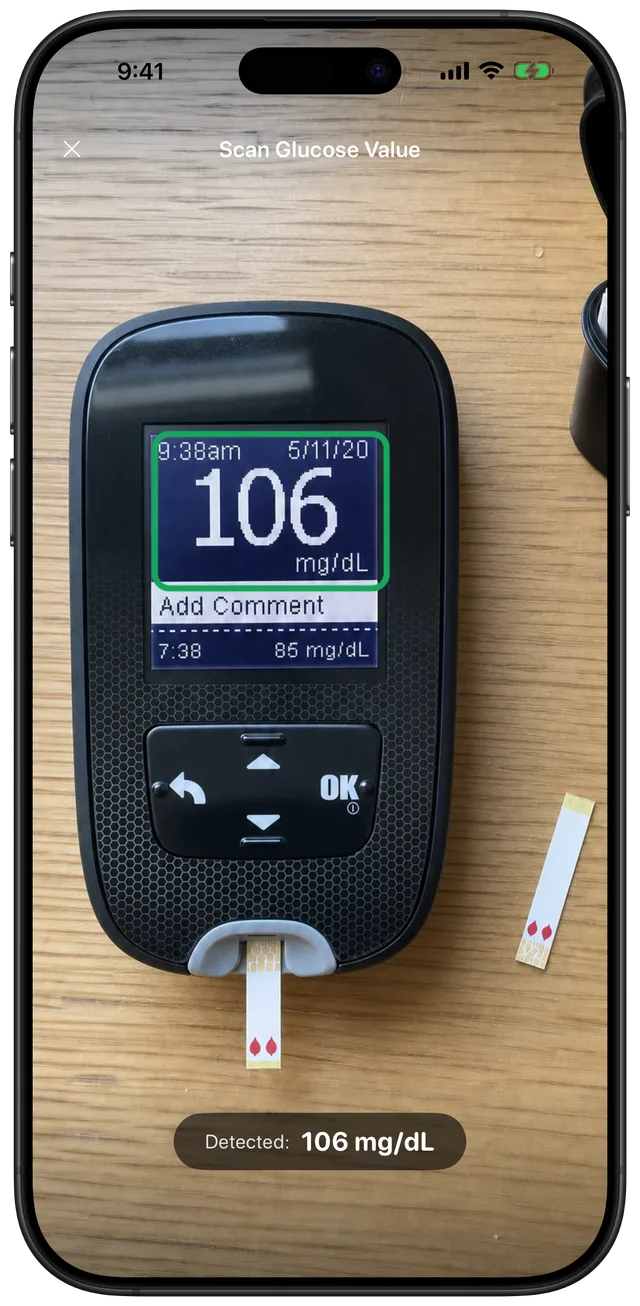
Skip the typing. Point the camera at your meter and Gludiary detects the reading for you.
Take your value from your glucose meter or CGM and enter it with the large-button numpad in either mg/dL or mmol/L. Gludiary does not measure blood sugar itself. It records the number you enter so you can build a clear history.
Mark each reading as fasting, before meal, after meal or bedtime, and add a note or custom tag if you like. That context is what turns a list of numbers into a pattern you and your doctor can actually read.
Your dashboard shows a 7-day trend, while the Charts tab opens 7-day to 1-year views with your average, minimum, maximum and a time-in-range breakdown. Gludiary also shows your GMI (Glucose Management Indicator) from your recent readings.
When it is time for an appointment, generate a compact or detailed PDF report, or export a CSV. Choose the date range and what to include, then share it. Your health records stay locally on your iPhone until you choose to export or share them.
Explore Gludiary workflows for Apple Health, private and offline logging, reports, camera scanning, reminders, and medication records.
Bring recent Apple Health glucose data into Gludiary, use Premium for ongoing import and write sync, and review it in one focused tracker.
Explore featureStart logging without a name, email address, sign-up flow, or Gludiary cloud account. Your glucose records are stored locally on your iPhone.
Explore featureChoose a date range, select the details to include, and turn your logged readings into a readable PDF or spreadsheet-friendly CSV.
Explore featurePoint the iPhone camera at your meter display to detect the digits, then check the value and save it with meal context.
Explore featureUse the meter you already have. Enter its reading with a large numpad, add meal context, and build charts without pairing hardware.
Explore featureCreate scheduled reminders for the checks in your routine, then record the meter value with meal context when the notification arrives.
Explore featureClear, honest answers to common questions about logging blood sugar, reading your trends, understanding your GMI, sharing reports and choosing your units, written to inform, not to diagnose.
Build a simple logging routine, learn what the fasting, before, after and bedtime tags mean, and see why consistency matters more than any single reading.
Read guideHow to read the 7-day to 1-year charts, what the time-in-range visual is telling you, and why the pattern matters more than any one reading.
Read guideHow Gludiary calculates your GMI from your average glucose, when it can mislead, and why it does not replace a lab A1C test.
Read guideGenerate a compact or detailed PDF, or a CSV export, and walk into your appointment prepared with a clear record.
Read guideWhich unit your country uses, how to switch in Gludiary, and the simple ×18 conversion between mg/dL and mmol/L.
Read guideEnter each reading from your meter or CGM with the large-button numpad, tag it by meal context: fasting, before meal, after meal or bedtime, and save it. Logging consistently builds a history and trends you can review and share. Gludiary stores it privately on your device. Learn more
The dashboard shows a 7-day trend, and the Charts tab offers 7-day to 1-year views with your average, minimum and maximum. Time in range shows the share of readings within your target band versus low or high. The pattern matters more than any single reading. Learn more
GMI (Glucose Management Indicator) is calculated from the average of your logged glucose using a published formula (GMI % = 3.31 + 0.02392 × average glucose in mg/dL). It updates as you log more readings, but it is only an estimate and does not replace a laboratory A1C test. Learn more
Yes. Gludiary generates a compact or detailed PDF report and a CSV export. You choose the date range and whether to include readings, charts, GMI and notes, then share it. It helps you arrive at appointments prepared with a clear record. Learn more
Both. You choose your preferred unit in Settings, and every reading, chart and report is shown in it. To convert between the two, multiply mmol/L by 18 for mg/dL, or divide mg/dL by 18 for mmol/L. Pick the unit your meter and doctor use. Learn more
No. Gludiary is not a glucose meter or CGM and cannot measure blood sugar. You take your reading with your own device, then enter the number into Gludiary, which records it, tags it by context, and turns your entries into trends, a GMI and reports.
Yes. Gludiary can read and write blood glucose to Apple Health, so your readings stay alongside the rest of your health data in one place. You control the connection, and HealthKit samples are not sent to Gludiary servers.
You do not need an account to log your readings. Raw glucose readings are stored locally on your iPhone and are not sent to Gludiary servers. Optional Apple Health access and exports happen only when you enable or initiate them.
Download Gludiary free and log your blood sugar in seconds, tag it by meal, follow your trends and time in range, see your GMI, and share a PDF or CSV report with your doctor. Your health records are stored locally on your iPhone. Gludiary does not measure glucose and provides general health information, not medical advice.
Download on the App Store